
Charts
Google charts Offical link Preview link
you have to install Google Chart
npm i ng2-google-charts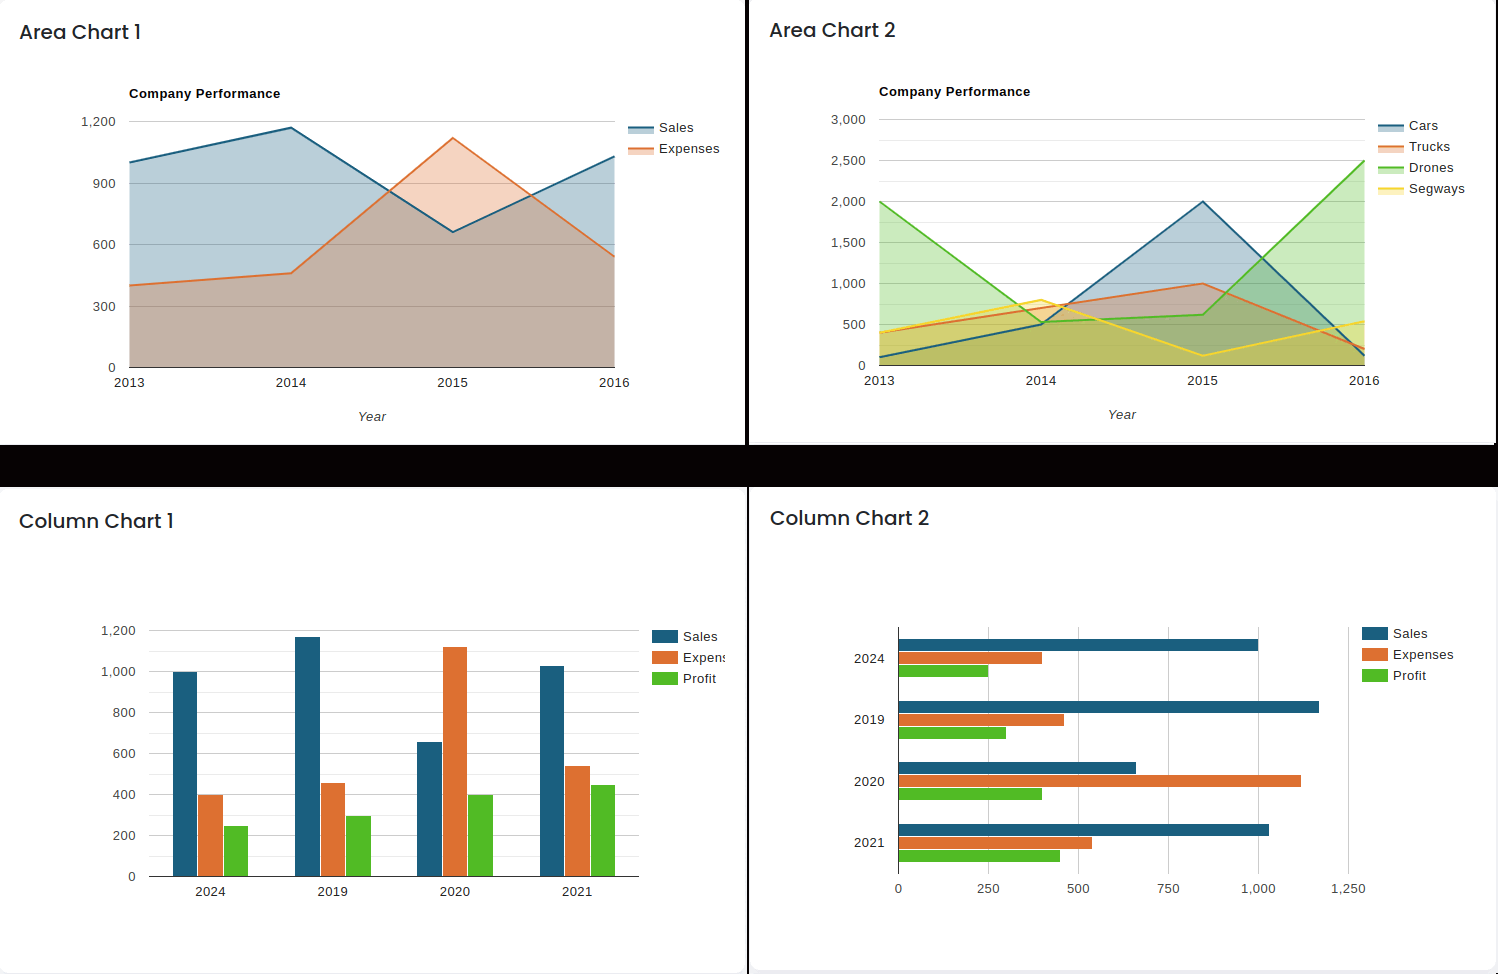
<!-- Html code for display google chart -->
<google-chart [data]="areaChart1"></google-chart>
<!-- google Chart Data-->
import { GoogleChartType } from "ng2-google-charts";

export var primary_color = localStorage.getItem('primary_color') || '#1a5f7f';
export var secondary_color = localStorage.getItem('secondary_color') || '#dd7031';

export const areaChart1 = {
  chartType: "AreaChart",
  dataTable: [
    ["Year", "Sales", "Expenses"],
    ["2013", 1000, 400],
    ["2014", 1170, 460],
    ["2015", 660, 1120],
    ["2016", 1030, 540],
  ],
  options: {
    title: "Company Performance",
    hAxis: { title: "Year", titleTextStyle: { color: "#333" } },
    vAxis: { minValue: 0, ticks: [0, 300, 600, 900, 1200] },
    width: "100%",
    height: 400,
    colors: [primary_color, secondary_color],
  },
};
google-chart.ts file
import { Component } from '@angular/core';
import { areaChart1 } from '../../../../shared/data/charts/google-chart';
import { Ng2GoogleChartsModule } from 'ng2-google-charts';
import { CardComponent } from "../../../../shared/components/card/card.component";

@Component({
    selector: 'app-area-chart1',

    templateUrl: './area-chart1.component.html',
    styleUrls: ['./area-chart1.component.scss'],
    imports: [Ng2GoogleChartsModule, CardComponent]
})

export class AreaChart1Component {

  public areaChart1 = areaChart1;


}
Chartjs charts Offical link Preview link
<!-- Html code -->
<canvas body baseChart class="chart" [datasets]="polarChartData" [labels]="polarChartLabels"
  [options]="polarChartOptions" [legend]="polarChartLegend" [type]="polarChartType"></canvas>
<!-- Chartjs charts data-->
import { ChartType } from "chart.js";

export var primary = localStorage.getItem('primary_color') || '#1a5f7f';
export var secondary = localStorage.getItem('secondary_color') || '#dd7031';

// Bar Graph
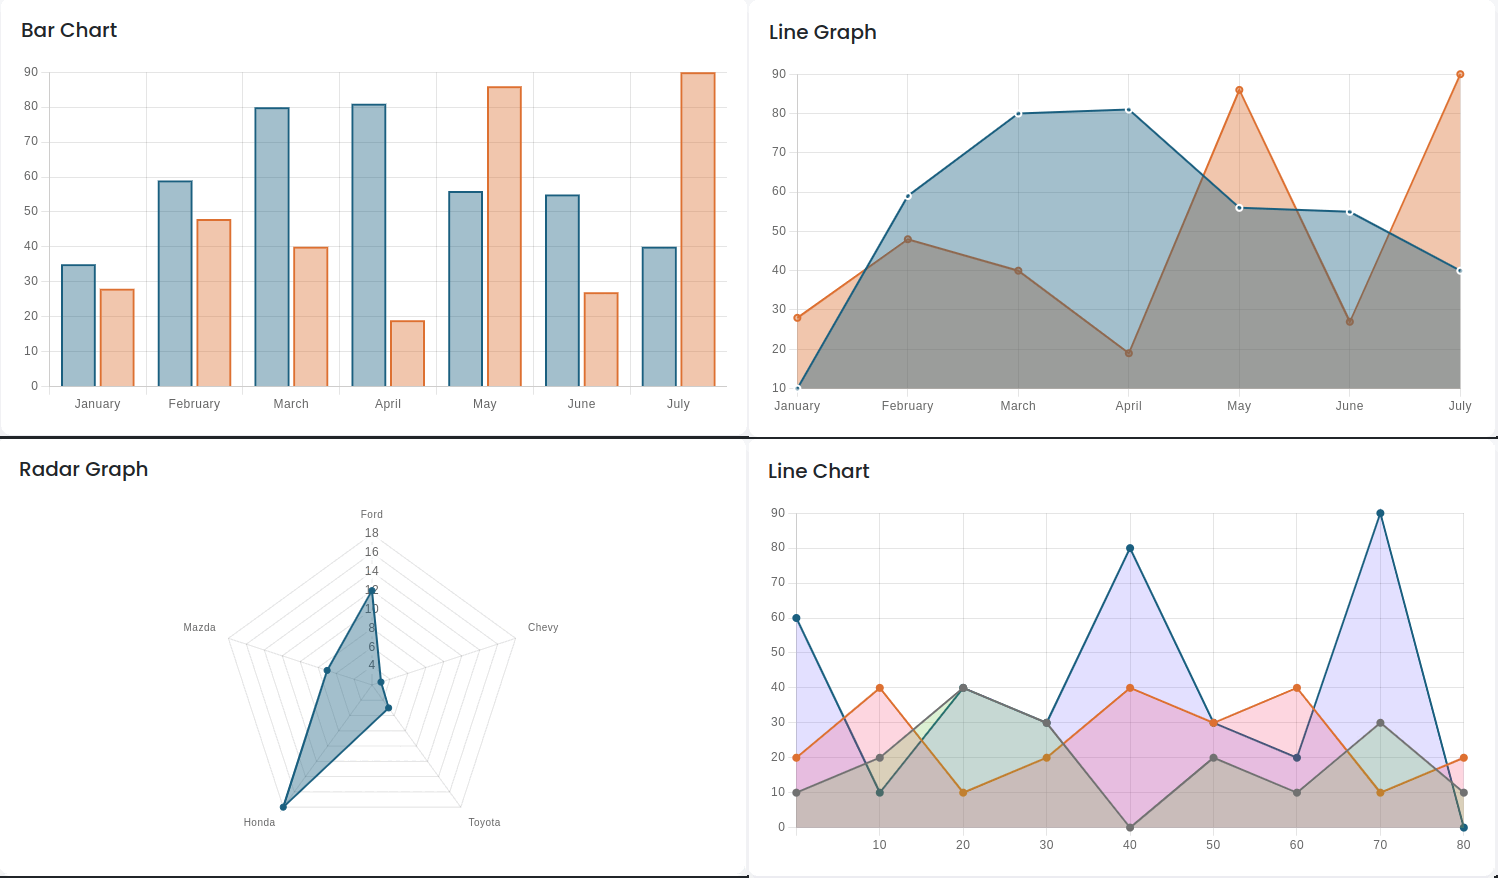
export var barChartChartLabels: string[] = [
  "January",
  "February",
  "March",
  "April",
  "May",
  "June",
  "July",
];
export var barChartChartType: ChartType | any = "bar";
export var barChartChartLegend = false;
export var barChartChartOptions: any = {
  scaleShowLabelBackdrop: true,
  scaleBeginAtZero: true,
  scaleShowGridLines: true,
  scaleGridLineColor: "rgba(0,0,0,0.1)",
  scaleGridLineWidth: 1,
  scaleShowHorizontalLines: true,
  scaleShowVerticalLines: true,
  barShowStroke: true,
  barStrokeWidth: 2,
  barValueSpacing: 5,
  barDatasetSpacing: 1,
};
export var barChartChartColors: any[] = [
  { backgroundColor: [primary, secondary] },
];
export var barChartChartData: any[] = [
  {
    label: "My First dataset",
    backgroundColor: "rgb(26, 95, 127, 0.4)",
    borderColor: primary,
    highlightBackgroundColor: "rgb(26, 95, 127, 0.6)",
    borderWidth: 2,
    highlightBorderColor: primary,
    data: [35, 59, 80, 81, 56, 55, 40],
  },
  {
    label: "My Second dataset",
    backgroundColor: "rgb(221, 112, 49, 0.4)",
    borderColor: secondary,
    highlightFill: "rgb(221, 112, 49, 0.6)",
    borderWidth: 2,
    highlightStroke: secondary,
    data: [28, 48, 40, 19, 86, 27, 90],
  },
];
<!-- Chart-js.ts file-->
import { Component } from '@angular/core';
import * as data from '../../../../shared/data/charts/chartjs';
import { BaseChartDirective } from 'ng2-charts';
import { CardComponent } from "../../../../shared/components/card/card.component";

@Component({
    selector: 'app-chartjs-bar-chart',
    templateUrl: './chartjs-bar-chart.component.html',
    styleUrls: ['./chartjs-bar-chart.component.scss'],
    imports: [BaseChartDirective, CardComponent]
})

export class ChartjsBarChartComponent {

  public barChartChartLabels = data.barChartChartLabels;
  public barChartChartData = data.barChartChartData;
  public barChartChartType = data.barChartChartType;
  public barChartChartColors = data.barChartChartColors;
  public barChartChartOptions = data.barChartChartOptions;
  public barChartChartLegend = data.barChartChartLegend;

}
app.config.ts
<!-- Chart-js.ts file-->
import { HttpClient, provideHttpClient } from '@angular/common/http';
import { provideAnimations } from '@angular/platform-browser/animations';
import { provideRouter } from '@angular/router';
import { routes } from './app.routes';
import { provideCharts, withDefaultRegisterables } from 'ng2-charts';

export const appConfig: ApplicationConfig = {
  providers: [
    provideZoneChangeDetection({ eventCoalescing: true }),
    provideRouter(routes),
    provideHttpClient(),
    provideAnimations(),
    provideCharts(withDefaultRegisterables()),
  ]
};
Chartist charts Offical link Preview link
you have to install Chartist charts
npm i ng-chartist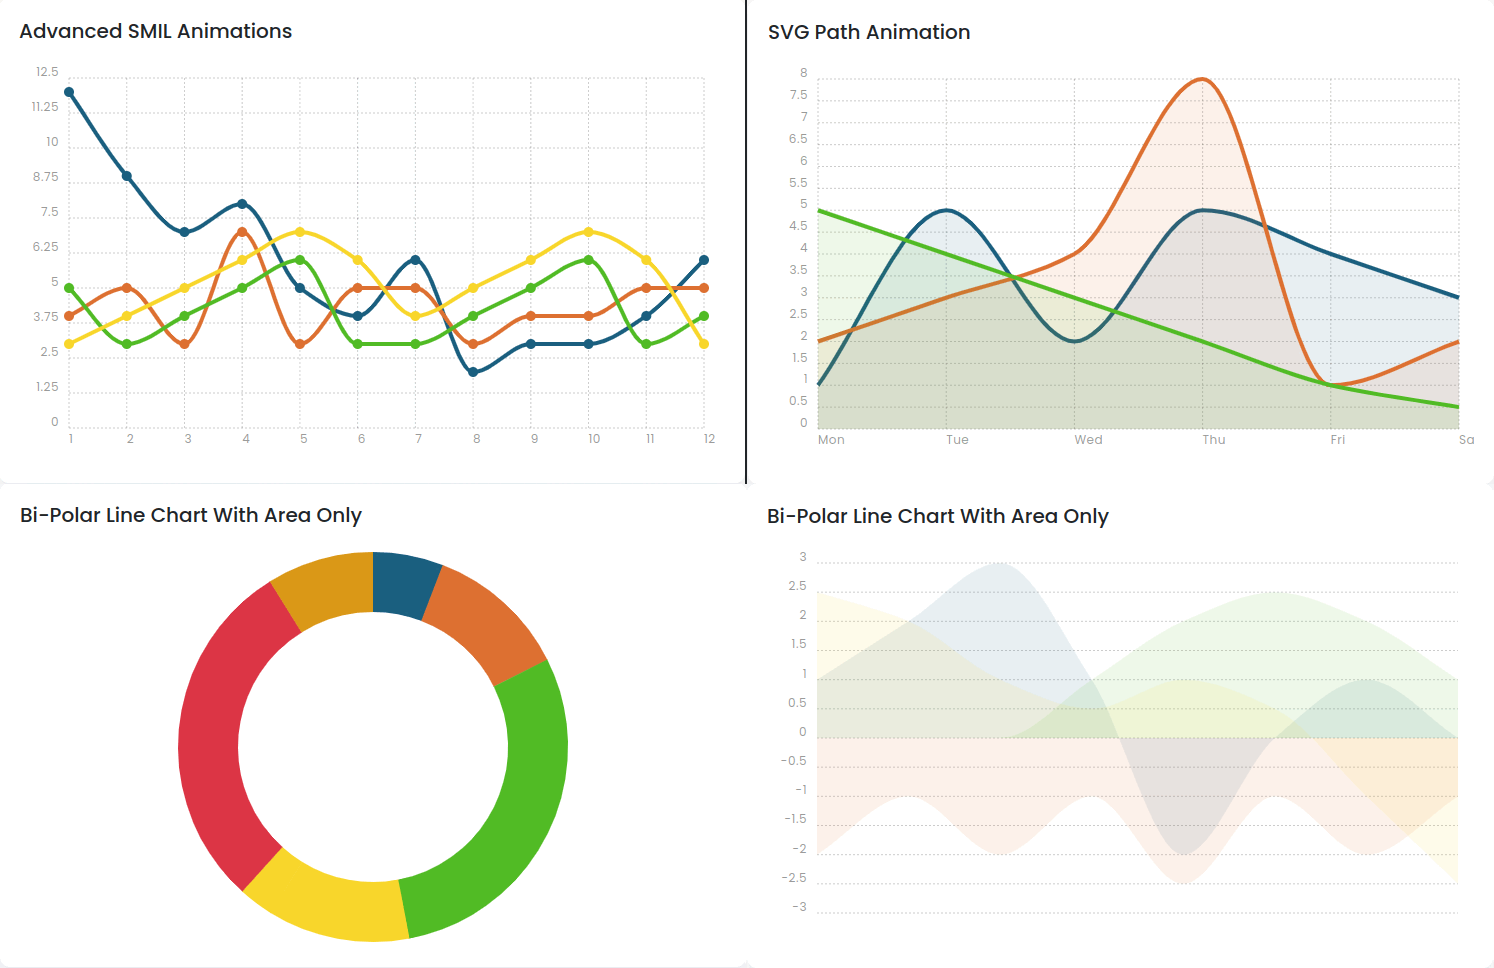
<!-- html file-->
<x-chartist [configuration]="chart1"></x-chartist>
<!-- data file-->
import * as Chartist from 'chartist';

export var primary_color = localStorage.getItem('primary_color') || '#1a5f7f';
export var secondary_color = localStorage.getItem('secondary_color') || '#dd7031';

var seq: number = 0;
var delays: number = 80;
var durations: number = 500;

export const chart1: any = {
  type: "Line",
  data: {
    labels: ["1", "2", "3", "4", "5", "6", "7", "8", "9", "10", "11", "12"],
    series: [
      [12, 9, 7, 8, 5, 4, 6, 2, 3, 3, 4, 6],
      [4, 5, 3, 7, 3, 5, 5, 3, 4, 4, 5, 5],
      [5, 3, 4, 5, 6, 3, 3, 4, 5, 6, 3, 4],
      [3, 4, 5, 6, 7, 6, 4, 5, 6, 7, 6, 3],
    ],
  },
  options: {
    low: 0,
    showArea: false,
    fullWidth: true,
		height: 400,
    width :700,
    colors: [primary_color, secondary_color],
  },
  events: {
    draw: (data: any) => {
      seq++;
      if (data.type === "line") {
        data.element.animate({
          opacity: {
            begin: seq * delays + 1000,
            dur: durations,
            from: 0,
            to: 1,
          },
        });
      } else if (data.type === "label" && data.axis === "x") {
        data.element.animate({
          y: {
            begin: seq * delays,
            dur: durations,
            from: data.y + 100,
            to: data.y,
            easing: "easeOutQuart",
          },
        });
      } else if (data.type === "label" && data.axis === "y") {
        data.element.animate({
          x: {
            begin: seq * delays,
            dur: durations,
            from: data.x - 100,
            to: data.x,
            easing: "easeOutQuart",
          },
        });
      } else if (data.type === "point") {
        data.element.animate({
          x1: {
            begin: seq * delays,
            dur: durations,
            from: data.x - 10,
            to: data.x,
            easing: "easeOutQuart",
          },
          x2: {
            begin: seq * delays,
            dur: durations,
            from: data.x - 10,
            to: data.x,
            easing: "easeOutQuart",
          },
          opacity: {
            begin: seq * delays,
            dur: durations,
            from: 0,
            to: 1,
            easing: "easeOutQuart",
          },
        });
      } else if (data.type === "grid") {
        var pos1Animation = {
          begin: seq * delays,
          dur: durations,
          from: data[data.axis.units.pos + "1"] - 30,
          to: data[data.axis.units.pos + "1"],
          easing: "easeOutQuart",
        };
        var pos2Animation = {
          begin: seq * delays,
          dur: durations,
          from: data[data.axis.units.pos + "2"] - 100,
          to: data[data.axis.units.pos + "2"],
          easing: "easeOutQuart",
        };
        var animations: any = {};
        animations[data.axis.units.pos + "1"] = pos1Animation;
        animations[data.axis.units.pos + "2"] = pos2Animation;
        animations["opacity"] = {
          begin: seq * delays,
          dur: durations,
          from: 0,
          to: 1,
          easing: "easeOutQuart",
        };
        data.element.animate(animations);
      }
    },
  },
};
<!-- ts file-->
import { Component } from "@angular/core";
import { chart1 } from "../../../../shared/data/charts/chartlist";
import { ChartistModule } from "ng-chartist";
import { CardComponent } from "../../../../shared/components/card/card.component";

@Component({
    selector: "app-advanced-smil-animations",
    templateUrl: "./advanced-smil-animations.component.html",
    styleUrls: ["./advanced-smil-animations.component.scss"],
    imports: [ChartistModule, CardComponent]
})

export class AdvancedSMILAnimationsComponent {

  public chart1 = chart1;

}
Apex charts Offical link Preview link
you have to install Apex charts
npm i ng-apexcharts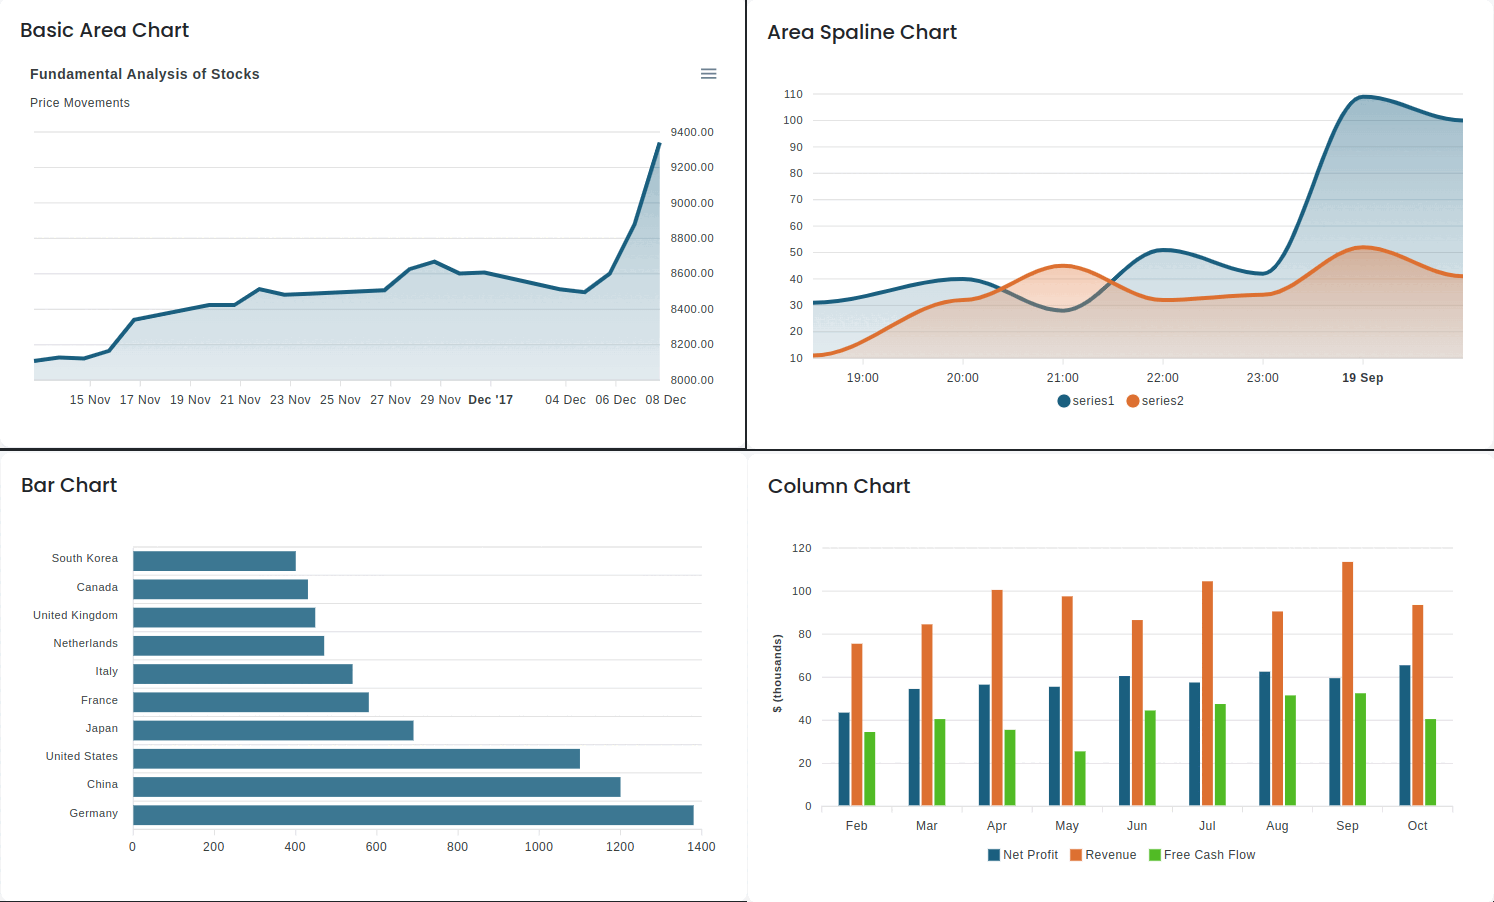
<!-- Html code -->
<apx-chart [chart]="basicAreaChart.chart" [dataLabels]="basicAreaChart.dataLabels" [stroke]="basicAreaChart.stroke"
   [series]="basicAreaChart.series" [title]="basicAreaChart.title" [subtitle]="basicAreaChart.subtitle"
   [labels]="basicAreaChart.labels" [xaxis]="basicAreaChart.xaxis" [yaxis]="basicAreaChart.yaxis"
   [legend]="basicAreaChart.legend" [colors]="basicAreaChart.colors">
</apx-chart>
<!-- data file -->
import {
  ApexAnnotations,
  ApexAxisChartSeries,
  ApexChart,
  ApexDataLabels,
  ApexFill,
  ApexGrid,
  ApexLegend,
  ApexMarkers,
  ApexNonAxisChartSeries,
  ApexPlotOptions,
  ApexResponsive,
  ApexStroke,
  ApexTheme,
  ApexTitleSubtitle,
  ApexXAxis,
  ApexYAxis,
} from "ng-apexcharts";
import { series } from "./chart-data";

export type ChartOptions = {
  series?: ApexAxisChartSeries;
  chart?: ApexChart;
  xaxis?: ApexXAxis;
  stroke?: ApexStroke;
  tooltip?: any;
  dataLabels?: ApexDataLabels;
  hover?: number;
  yaxis?: ApexYAxis;
  legend?: ApexLegend;
  labels?: string[];
  plotOptions?: ApexPlotOptions;
  fill?: ApexFill;
  responsive?: ApexResponsive[];
  pieseries?: ApexNonAxisChartSeries;
  title?: ApexTitleSubtitle;
  theme?: ApexTheme;
  colors?: string[];
  markers?: ApexMarkers;
  annotations?: ApexAnnotations;
  grid?: ApexGrid;
};

 var primary_color = localStorage.getItem('primary_color') || '#1a5f7f';
 var secondary_color = localStorage.getItem('secondary_color') || '#dd7031';

export let basicAreaChart: ChartOptions | any = {
  series: [
    {
      name: "STOCK ABC",
      data: series.monthDataSeries1.prices
    }
  ],
  chart: {
    type: "area",
    height: 350,
    zoom: {
      enabled: false
    }
  },
  dataLabels: {
    enabled: false
  },
  stroke: {
    curve: "straight"
  },
  title: {
    text: "Fundamental Analysis of Stocks",
    align: "left"
  },
  subtitle: {
    text: "Price Movements",
    align: "left"
  },
  labels: series.monthDataSeries1.dates,
  xaxis: {
    type: "datetime"
  },
  yaxis: {
    opposite: true
  },
  legend: {
    horizontalAlign: "left"
  },
  colors: [primary_color],
}
<!-- ts file -->
import { Component } from '@angular/core';
import { basicAreaChart } from '../../../../shared/data/charts/apex-chart';
import { NgApexchartsModule } from 'ng-apexcharts';
import { CardComponent } from "../../../../shared/components/card/card.component";

@Component({
    selector: 'app-basic-area-chart',
    templateUrl: './basic-area-chart.component.html',
    styleUrls: ['./basic-area-chart.component.scss'],
    imports: [NgApexchartsModule, CardComponent]
})

export class BasicAreaChartComponent {

   public basicAreaChart = basicAreaChart;

}