
Charts
Apex Chart Offical link Preview link
you have to install Apex charts
npm i ng-apexcharts
  <apx-chart [chart]="basicAreaChart.chart" [series]="basicAreaChart.series" [colors]="basicAreaChart.colors"
  [dataLabels]="basicAreaChart.dataLabels" [xaxis]="basicAreaChart.xaxis" [yaxis]="basicAreaChart.yaxis"
  [stroke]="basicAreaChart.stroke" [labels]="basicAreaChart.labels" [legend]="basicAreaChart.legend">
  </apx-chart>
ts file
  import { Component } from '@angular/core';
  import * as chartData from '../../../../shared/data/charts/apex-charts';
  import { NgApexchartsModule } from 'ng-apexcharts';

  @Component({
    selector: 'app-basic-area-chart',
    templateUrl: './basic-area-chart.html',
    styleUrls: ['./basic-area-chart.scss'],
    imports: [NgApexchartsModule]
  })

  export class BasicAreaChart {

  public basicAreaChart = chartData.splineArea1

  }
data file
    export interface StepLineChart {
      chart: ApexChart;
      stroke: ApexStroke;
      dataLabels: ApexDataLabels;
      series: ApexAxisChartSeries;
      title: ApexTitleSubtitle;
      markers: ApexMarkers;
      colors: string[];
    }


  let primary_color = localStorage.getItem('primary_color') || '#008dab';
  let secondary_color = localStorage.getItem('secondary_color') || '#e87f24';

  export let stepLineChart: StepLineChart = {
    series: [
      {
        name: 'stepline-series',
        data: [34, 44, 54, 21, 12, 43, 33, 23, 66, 66, 58],
      },
    ],
    colors: [primary_color],
    chart: {
      type: 'line',
      height: 350,
      toolbar: {
        show: false,
      },
    },
    stroke: {
      curve: 'stepline',
    },
    dataLabels: {
      enabled: false,
    },
    title: {
      text: 'Stepline Chart',
      align: 'left',
    },
    markers: {
      hover: {
        sizeOffset: 4,
      },
    },
  };
Google charts Offical link Preview link
you have to install Google Chart
npm i ng2-google-charts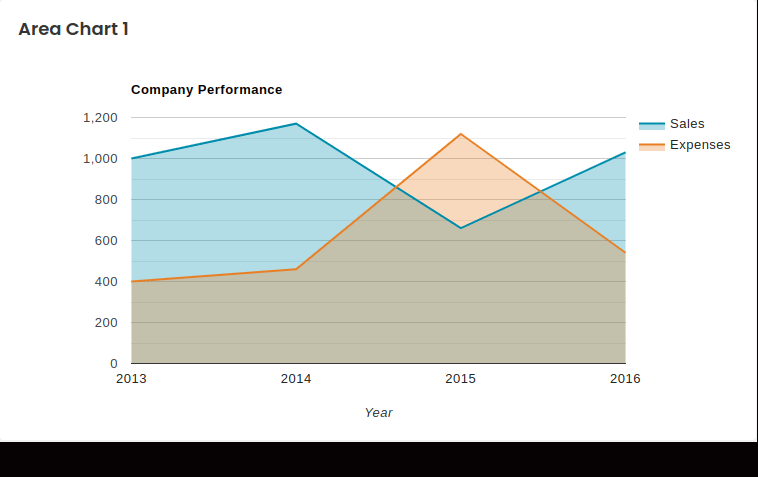
<google-chart [data]="areaChart1"></google-chart>
import { Component } from '@angular/core';
import * as chartData from '../../../../shared/data/charts/google-chart';
import { Ng2GoogleChartsModule } from 'ng2-google-charts';

@Component({
    selector: 'app-area-chart1',
    templateUrl: './area-chart1.html',
    styleUrls: ['./area-chart1.scss'],
    imports: [Ng2GoogleChartsModule]
})
export class AreaCharnt {

  public areaChart1 = chartData.areaChart1

}
let primary_color = localStorage.getItem('primary_color') || '#008dab';
let secondary_color = localStorage.getItem('secondary_color') || '#e87f24';

export var areaChart1 = {
    chartType: 'AreaChart',
    dataTable: [
        ['Year', 'Sales', 'Expenses'],
        ['2013', 1000, 400],
        ['2014', 1170, 460],
        ['2015', 660, 1120],
        ['2016', 1030, 540]
    ],
    options: {
        title: 'Company Performance',
        hAxis: { title: 'Year', titleTextStyle: { color: '#333' } },
        vAxis: { minValue: 0 },
        width: '100%',
        height: 400,
        colors: [primary_color, secondary_color],
        backgroundColor: 'transparent'
    },
};
ChartJs charts Offical link Preview link
you have to install ChartJs Chart
npm i ng2-charts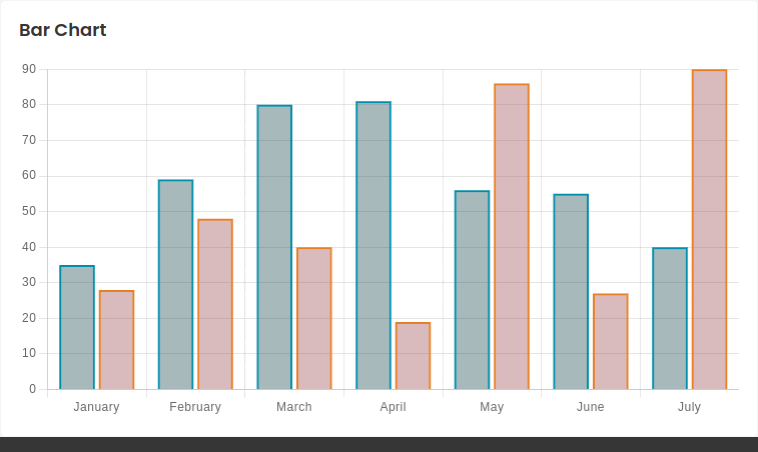
<canvas baseChart class="chart" [data]="barChart" [datasets]="barChart.datasets"
    [options]="barChartChartOptions" >
</canvas>
import { Component } from '@angular/core';
import * as chartData from '../../../../shared/data/charts/chartsjs';
import { BaseChartDirective } from 'ng2-charts';

@Component({
    selector: 'app-bars-chart',
    templateUrl: './bars-chart.html',
    styleUrls: ['./bars-chart.scss'],
    imports: [BaseChartDirective]
})

export class BarsChant {

  public barChart = chartData.barChart;
}
data files
import { ChartDataset, ChartOptions, ChartType } from 'chart.js';

let primary_color = '#008dab';
let secondary_color = '#e87f24';

export const barChart = {
  labels: ['January', 'February', 'March', 'April', 'May', 'June', 'July'],
  responsive: false,
  datasets: [
    {
      label: 'My First dataset',
      backgroundColor: 'rgba(43, 94, 94, 0.4)',
      borderColor: primary_color,
      borderWidth: 2,
      data: [35, 59, 80, 81, 56, 55, 40],
    },
    {
      label: 'My Second dataset',
      borderColor: secondary_color,
      backgroundColor: 'rgba(192, 98, 64, 0.4)',
      borderWidth: 2,
      data: [28, 48, 40, 19, 86, 27, 90],
    },
  ],
  barOptions: [
    {
      scaleBeginAtZero: true,
      scaleShowGridLines: true,
      scaleGridLineColor: 'rgba(0,0,0,0.1)',
      scaleGridLineWidth: 1,
      scaleShowHorizontalLines: true,
      scaleShowVerticalLines: true,
      barShowStroke: true,
      barStrokeWidth: 2,
      barValueSpacing: 5,
      barDatasetSpacing: 1,
    },
  ],
};
app.config.ts
import { HttpClient, provideHttpClient } from '@angular/common/http';
import { ApplicationConfig, provideZoneChangeDetection } from '@angular/core';
import { provideAnimations } from '@angular/platform-browser/animations';
import { provideRouter } from '@angular/router';
import { TranslateHttpLoader } from '@ngx-translate/http-loader';
import { provideCharts, withDefaultRegisterables } from 'ng2-charts';
import { routes } from './app.routes';

export function HttpLoaderFactory(httpClient: HttpClient) {
  return new TranslateHttpLoader(httpClient);
}

export const appConfig: ApplicationConfig = {
  providers: [
    provideZoneChangeDetection({ eventCoalescing: true }),
    provideRouter(routes),
    provideCharts(withDefaultRegisterables()),
    provideHttpClient(),
    provideAnimations(),
  ]
};
Chart List Offical link Preview link
you have to install Chartist charts
npm i ng-chartist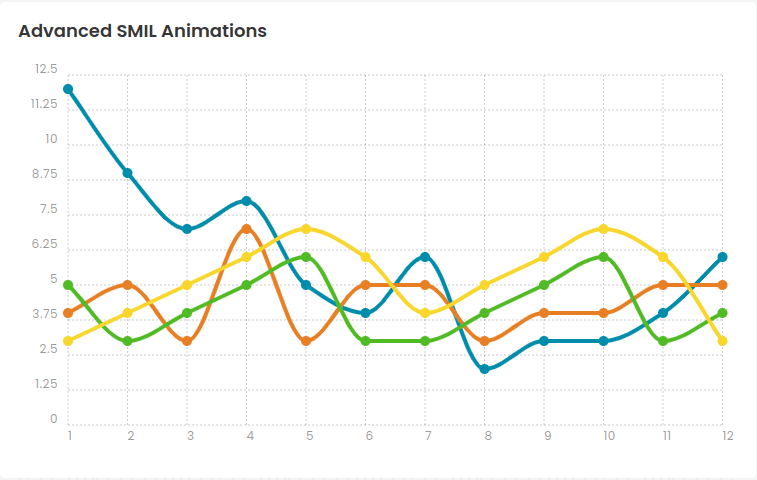
<x-chartist [configuration]="chart1"></x-chartist>
import { Component } from '@angular/core';
import * as chartData from '../../../../shared/data/charts/chartist';
import { ChartistModule } from 'ng-chartist';

@Component({
    selector: 'app-advanced-smil',
    templateUrl: './advanced-smil.html',
    styleUrls: ['./advanced-smil.scss'],
    imports: [ChartistModule]
})
export class AdvancedSmnt {

  public chart1 = chartData.chart1;

}
import * as Chartist from 'chartist';
import { BarChartConfiguration, LineChartConfiguration, PieChartConfiguration } from 'ng-chartist';

// chart 1 Advanced SMIL Animations //

export var chart1: LineChartConfiguration = {
  type: 'Line',
  data: {
    labels: ['1', '2', '3', '4', '5', '6', '7', '8', '9', '10', '11', '12'],
    series: [
      [12, 9, 7, 8, 5, 4, 6, 2, 3, 3, 4, 6],
      [4, 5, 3, 7, 3, 5, 5, 3, 4, 4, 5, 5],
      [5, 3, 4, 5, 6, 3, 3, 4, 5, 6, 3, 4],
      [3, 4, 5, 6, 7, 6, 4, 5, 6, 7, 6, 3],
    ],
  },
  options: {
    low: 0,
    showArea: false,
    fullWidth: true,
    height: 250,
  },
};