
Charts
Google charts Offical link Preview link
you have to install Google Chart
npm i ng2-google-charts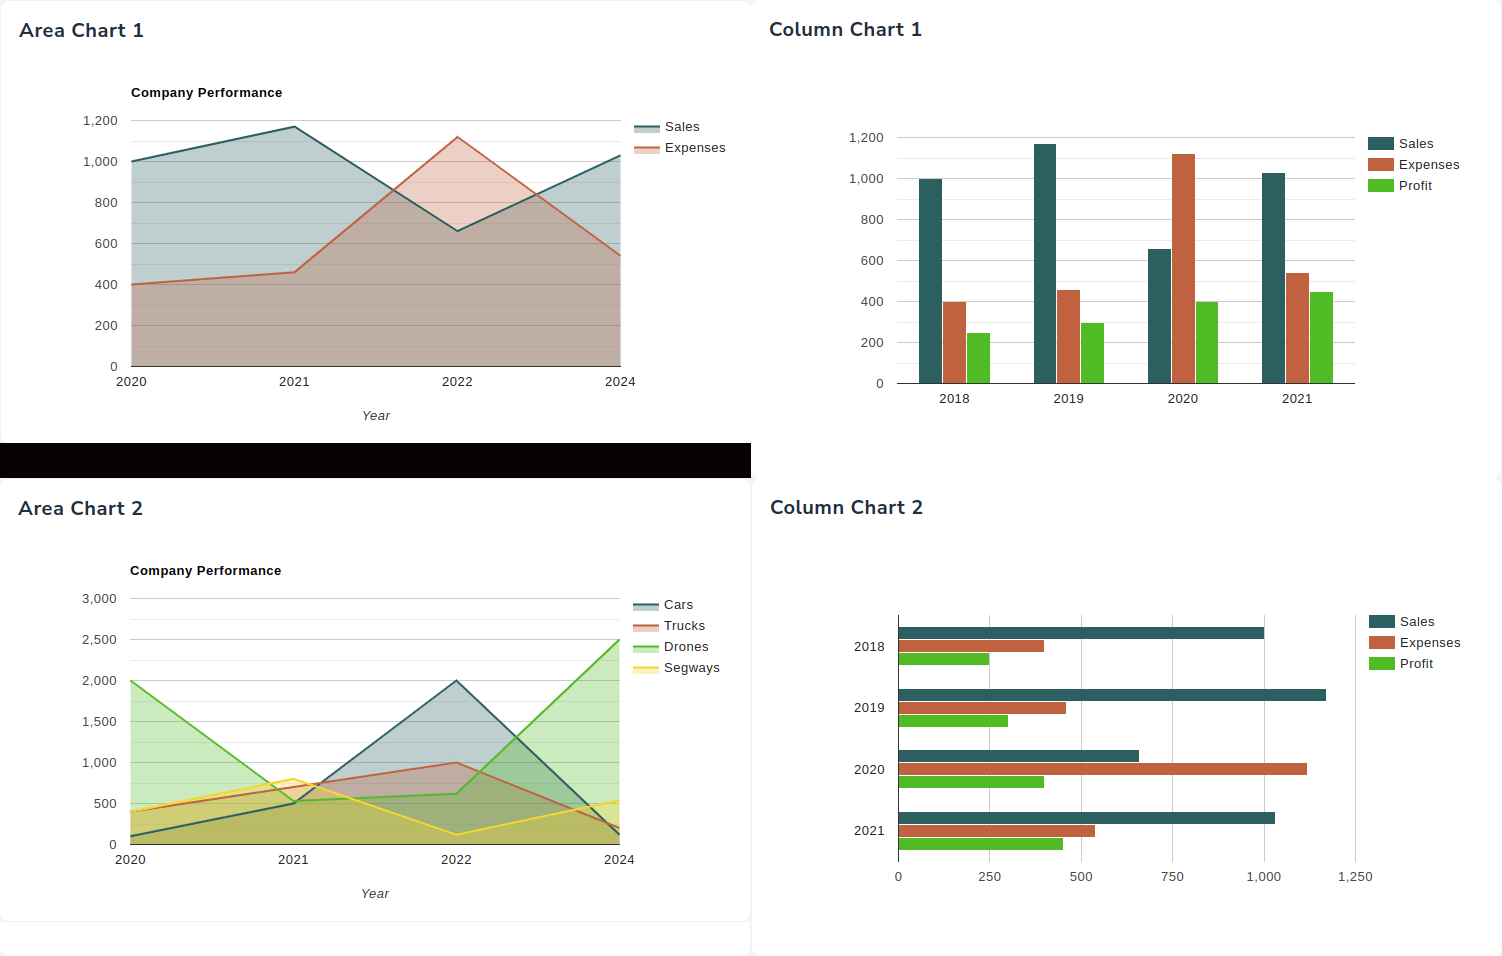
<!-- Html code for display google chart -->
<google-chart [data]="areaChart1"></google-chart>
<!-- google Chart Data-->
  export var areaChart1 = {
    chartType: 'AreaChart',
    dataTable: [
      ['Year', 'Sales', 'Expenses'],
      ['2020', 1000, 400],
      ['2021', 1170, 460],
      ['2022', 660, 1120],
      ['2024', 1030, 540],
    ],
    options: {
      title: 'Company Performance',
      hAxis: { title: 'Year', titleTextStyle: { color: '#333' } },
      vAxis: { minValue: 0 },
      width: '100%',
      height: 400,
      colors: [primary_color, secondary_color],
      backgroundColor: 'transparent',
    },
  };
google-chart.ts file
import { Component } from '@angular/core';
import * as chartData from '../../../../shared/data/charts/google-chart';
import { Ng2GoogleChartsModule } from 'ng2-google-charts';

@Component({
    selector: 'app-area-chart1',
    templateUrl: './area-chart1.html',
    styleUrls: ['./area-chart1.scss'],
    imports: [Ng2GoogleChartsModule]
})
export class AreaChart1 {

  public areaChart1 = chartData.areaChart1

}
Chartjs charts Offical link Preview link

<!-- Html code -->
<canvas baseChart class="chart" [data]="barChart" [datasets]="barChart.datasets"
    [options]="barChartChartOptions">
</canvas>
<!-- Chartjs charts data-->
import { ChartDataset, ChartOptions, ChartType } from 'chart.js';

let primary_color =  '#2B5F60';
let secondary_color = '#C06240';

export const barChart = {
  labels: ['January', 'February', 'March', 'April', 'May', 'June', 'July'],
  responsive: false,
  datasets: [
    {
      label: 'My First dataset',
      backgroundColor: 'rgba(43, 94, 94, 0.4)',
      borderColor: primary_color,
      borderWidth: 2,
      data: [35, 59, 80, 81, 56, 55, 40],
    },
    {
      label: 'My Second dataset',
      borderColor: secondary_color,
      backgroundColor: 'rgba(192, 98, 64, 0.4)',
      borderWidth: 2,
      data: [28, 48, 40, 19, 86, 27, 90],
    },
  ],
  barOptions: [
    {
      scaleBeginAtZero: true,
      scaleShowGridLines: true,
      scaleGridLineColor: 'rgba(0,0,0,0.1)',
      scaleGridLineWidth: 1,
      scaleShowHorizontalLines: true,
      scaleShowVerticalLines: true,
      barShowStroke: true,
      barStrokeWidth: 2,
      barValueSpacing: 5,
      barDatasetSpacing: 1,
    },
  ],
};
<!-- Chart-js.ts file-->
  import { Component } from '@angular/core';

  import { BarController, BarElement, CategoryScale, LinearScale } from 'chart.js';
  import { BaseChartDirective, provideCharts } from 'ng2-charts';

  import { barChart } from '../../../../shared/data/charts/chartsjs';

  @Component({
    selector: 'app-bars-chart',
    templateUrl: './bars-chart.html',
    styleUrls: ['./bars-chart.scss'],
    imports: [BaseChartDirective],
    providers: [
      provideCharts({
        registerables: [BarController, CategoryScale, LinearScale, BarElement],
      }),
    ],
  })
  export class BarsChart {
    public barChart = barChart;
  }
app.config.ts
<!-- Chart-js.ts file-->
import { HttpClient, provideHttpClient } from '@angular/common/http';
import { provideAnimations } from '@angular/platform-browser/animations';
import { provideRouter } from '@angular/router';
import { routes } from './app.routes';
import { provideCharts, withDefaultRegisterables } from 'ng2-charts';

export const appConfig: ApplicationConfig = {
  providers: [
    provideZoneChangeDetection({ eventCoalescing: true }),
    provideRouter(routes),
    provideHttpClient(),
    provideAnimations(),
    provideCharts(withDefaultRegisterables()),
  ]
};
Chartist charts Offical link Preview link
you have to install Chartist charts
npm i ng-chartist
<!-- html file-->
<x-chartist [configuration]="chart1"></x-chartist>
<!-- data file-->
import * as Chartist from 'chartist';
import { BarChartConfiguration, LineChartConfiguration, PieChartConfiguration } from 'ng-chartist

var seq: number = 0;
var delays: number = 80;
var durations: number = 500;

let primary_color = localStorage.getItem('primary_color') || '#2B5F60';
let secondary_color = localStorage.getItem('secondary_color') || '#C06240';

export var chart1: LineChartConfiguration = {
  type: 'Line',
  data: {
    labels: ['1', '2', '3', '4', '5', '6', '7', '8', '9', '10', '11', '12'],
    series: [
      [12, 9, 7, 8, 5, 4, 6, 2, 3, 3, 4, 6],
      [4, 5, 3, 7, 3, 5, 5, 3, 4, 4, 5, 5],
      [5, 3, 4, 5, 6, 3, 3, 4, 5, 6, 3, 4],
      [3, 4, 5, 6, 7, 6, 4, 5, 6, 7, 6, 3],
    ],
  },
  options: {
    low: 0,
    showArea: false,
    fullWidth: true,
    height: 250,
  },
};
<!-- ts file-->
import { Component } from '@angular/core';
import * as chartData from '../../../../shared/data/charts/chartist';
import { ChartistModule } from 'ng-chartist';

@Component({
    selector: 'app-advanced-smil',
    templateUrl: './advanced-smil.html',
    styleUrls: ['./advanced-smil.scss'],
    imports: [ChartistModule]
})

export class AdvancedSmil {

  public chart1 = chartData.chart1;

}
Apex charts Offical link Preview link
you have to install Apex charts
npm i ng-apexcharts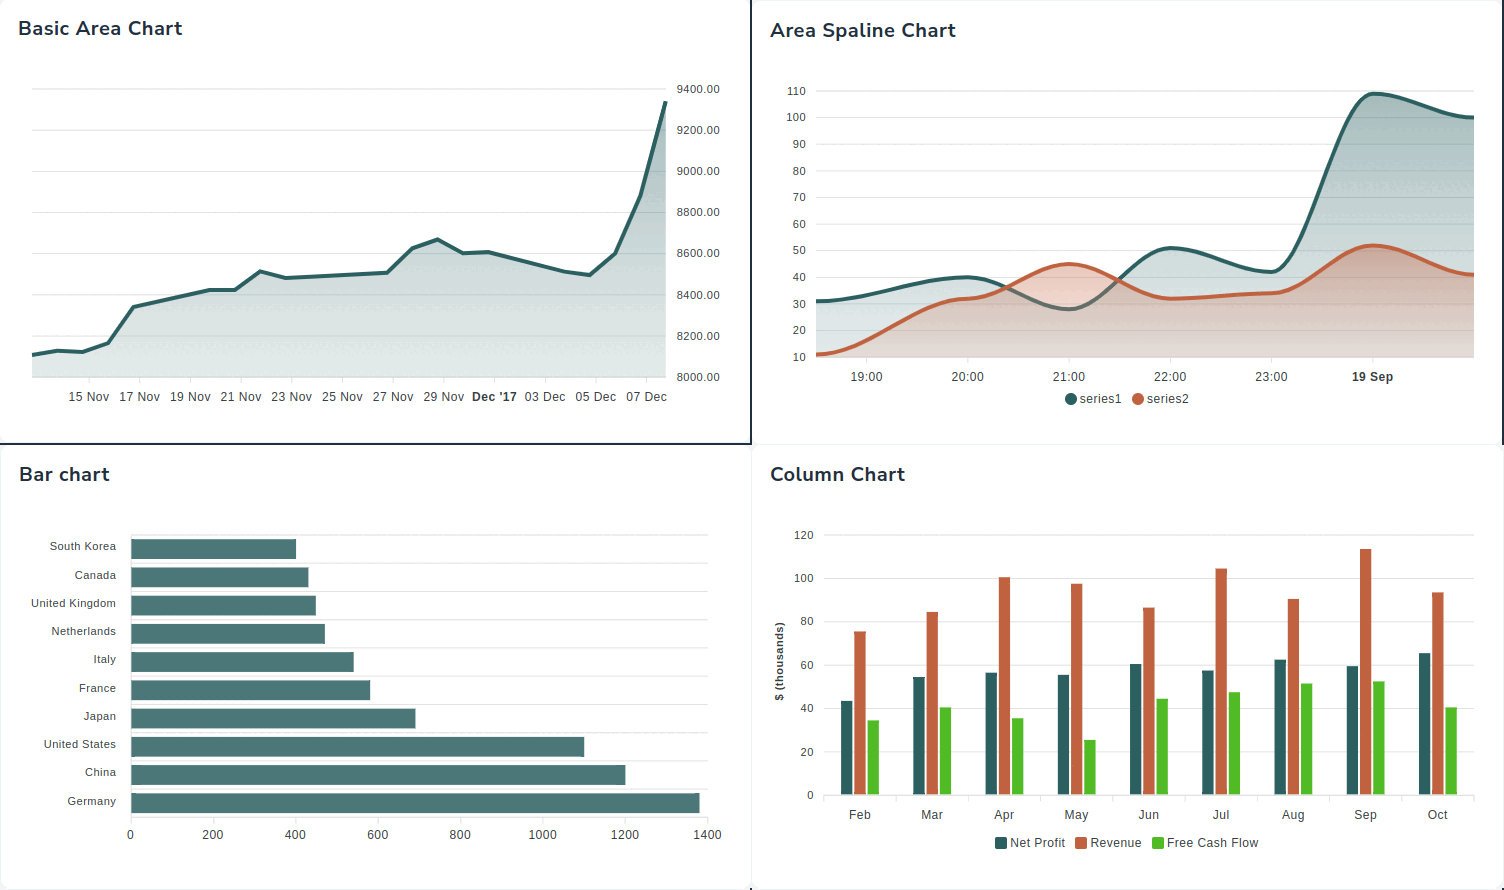
<!-- Html code -->
<apx-chart [chart]="BaicAeraChart.chart" [series]="BaicAeraChart.series" [colors]="BaicAeraChart.colors"
    [dataLabels]="BaicAeraChart.dataLabels" [xaxis]="BaicAeraChart.xaxis" [yaxis]="BaicAeraChart.yaxis"
    [stroke]="BaicAeraChart.stroke" [labels]="BaicAeraChart.labels" [legend]="BaicAeraChart.legend">
</apx-chart>
<!-- data file -->
import {BasicChart} from '../../interface/charts/apex-charts';
let primary_color = localStorage.getItem('primary_color') || '#2B5F60';
let secondary_color = localStorage.getItem('secondary_color') || '#C06240';

export let splineArea1 :BasicChart = {
    series: [
        {
            name: "STOCK ABC",
            data: [8107.85, 8128.0, 8122.9, 8165.5, 8340.7, 8423.7, 8423.5, 8514.3, 8481.85, 8487.7, 8506.9, 8626.2, 8668.95, 8602.3, 8607.55, 8512.9, 8496.25, 8600.65, 8881.1, 9340.85],
        }
    ],
    colors: [primary_color],
    chart: {
        type: "area",
        height: 350,
        toolbar: {
            show: false
        },
        zoom: {
            enabled: false
        }
    },
    dataLabels: {
        enabled: false
    },
    stroke: {
        curve: "straight"
    },
    labels: ["13 Nov 2017", "14 Nov 2017", "15 Nov 2017", "16 Nov 2017", "17 Nov 2017", "20 Nov 2017", "21 Nov 2017", "22 Nov 2017", "23 Nov 2017", "24 Nov 2017", "27 Nov 2017", "28 Nov 2017", "29 Nov 2017", "30 Nov 2017", "01 Dec 2017", "04 Dec 2017", "05 Dec 2017", "06 Dec 2017", "07 Dec 2017", "08 Dec 2017"
    ],
    xaxis: {
        type: "datetime"
    },
    yaxis: {
        opposite: true
    },
    legend: {
        horizontalAlign: "left"
    }
};
<!-- ts file -->
import { Component } from '@angular/core';
import * as chartData from '../../../../shared/data/charts/apex-charts';
import { NgApexchartsModule } from 'ng-apexcharts';

@Component({
    selector: 'app-basic-area-chart',
    templateUrl: './basic-area-chart.html',
    styleUrls: ['./basic-area-chart.scss'],
    imports: [NgApexchartsModule]
})

export class BasicAreaChart {

  public BaicAeraChart = chartData.splineArea1

}